Line Shopping and Closing Line Value for MLB
 Available in US
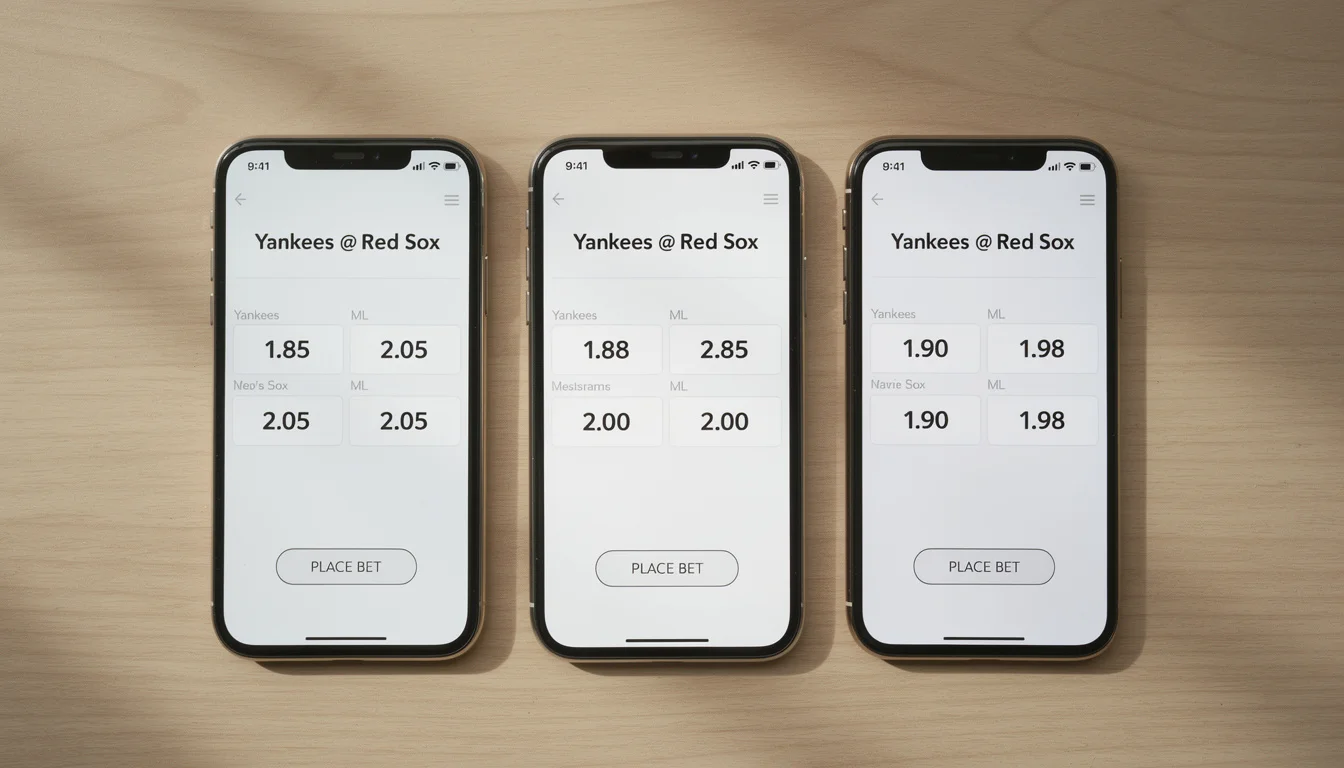
Table of Contents
- The Single Habit That Separates Sharp Punters from Casual Ones
- What Line Shopping Actually Looks Like
- Decimal Versus American Odds: A Comparison Across UK Books
- Closing Line Value as the Key Metric
- Bookmaker Hold Rates and What They Mean
- Timing the Bet: Open Versus Close
- Building a Line Shopping Routine
- Frequently asked questions on MLB line shopping and closing line value
The Single Habit That Separates Sharp Punters from Casual Ones
The first time someone explained closing line value to me, I argued with them for a full hour. The idea sounded too clean. The claim was that the only reliable measure of betting skill — the one that predicts long-run profitability better than win rate, better than return on investment, better than any other metric — was the average price at which I placed my bets compared with the closing line on the same selection. Not whether the bet won. The price. I refused to accept it for months. I now treat it as the single most important variable in my own bankroll management, and the habit that produces it — systematic line shopping across multiple UK operators — is the one I would recommend most strongly to anyone serious about MLB betting.
The maths is straightforward in hindsight. If I consistently bet a moneyline at decimal 2.10 and the market closes at 2.00, I have captured 5% of expected value above closing price. Across enough fixtures, that captured value compounds into actual return regardless of whether any given bet wins or loses. The closing line is the bookmaker’s most refined estimate of fair price, sharpened by the full weight of pre-match information and market liquidity. Betting at better prices than closing is the structural source of long-run edge.
The UK bookmaker landscape contains around 5,825 betting shops as of March 2025 — down 30% from 8,304 in 2019 — alongside the 13.5 million active monthly online accounts. The high-street footprint matters less than it once did, but the online operator population is what drives the line-shopping opportunity. The premium UK books, the mid-tier operators, and the smaller specialist operators all price MLB markets independently, and the price differences between them are the raw material that line shopping converts into expected value.
What Line Shopping Actually Looks Like
Line shopping is the practice of comparing the same selection at multiple bookmakers and placing the bet at the operator offering the best price. The mechanic is straightforward, but the discipline of doing it consistently across every bet is what separates the punters who benefit from those who do not.
The practical implementation requires accounts at several UK operators. The minimum effective number is three — typically two premium operators plus one mid-tier book. Five accounts gives you meaningful coverage across most markets. More than seven accounts produces diminishing returns and increasing administrative overhead. My personal account count sits at five, which I find captures most of the available price dispersion across MLB markets.
The pricing comparison happens at the moment of bet placement. For each selection I want to back, I check the price at each of my five operators and place the bet at the best available price. The check takes 30-60 seconds per bet using bookmaker apps side-by-side; the discipline is to do it every time rather than to settle for the price at whichever account is most convenient.
The average price improvement from line shopping across five UK operators on MLB markets is roughly 1-2% in implied probability terms, with occasional fixtures showing 3-5% spreads on moneylines and even wider spreads on totals and props. The 1-2% average is meaningful — across a season of bets, it compounds into a measurable return advantage that often exceeds the bookmaker margin on the markets being bet.
The MLB markets that show the widest price dispersion are the secondary markets: alternative run lines, alternative totals, pitcher props, and home run props. The headline moneylines are typically priced within 2-3% across all major UK operators because the sharp money flows there first and equalises the market. The secondary markets receive less sharp attention and therefore show wider price dispersion — which means line shopping is most valuable precisely on the markets where you are most likely to bet for value reasons.
Decimal Versus American Odds: A Comparison Across UK Books
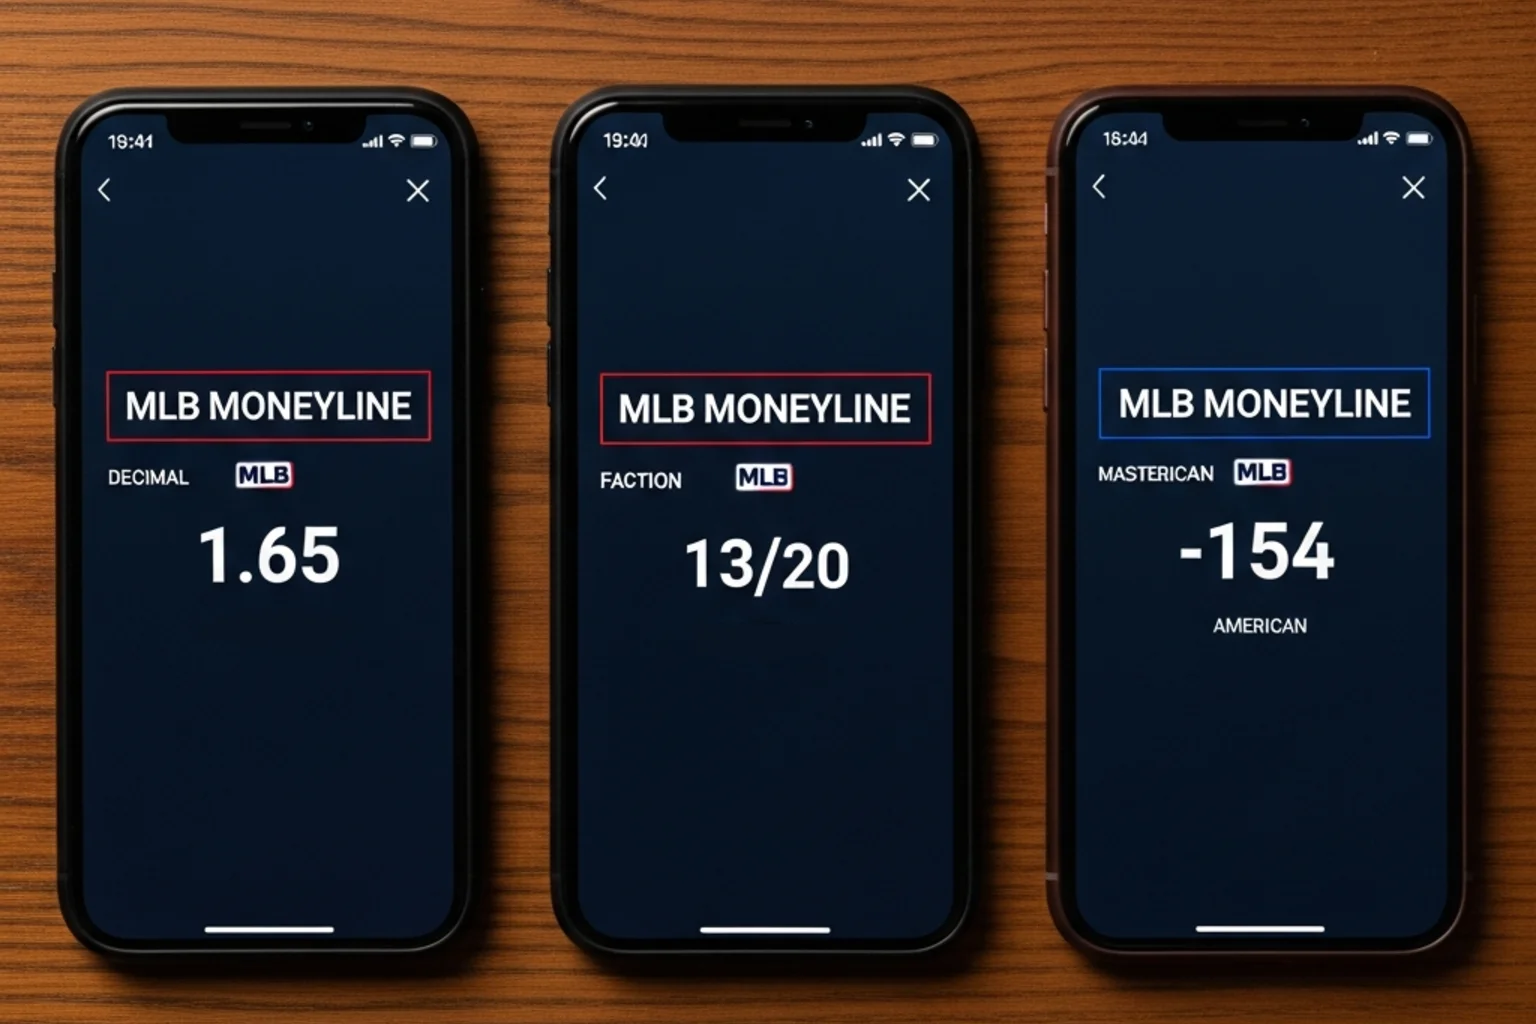
UK bookmakers display MLB odds in either decimal or fractional format by default, with American format available as an option at most operators. The decimal versus American odds framework covers the conversion mechanics in detail; what matters for line shopping is that small fractional differences in the displayed odds can mask the actual price improvement you are capturing.
A moneyline displayed at 11/10 (decimal 2.10) at one operator versus 10/11 (decimal 1.91) at another might look like comparable prices to a casual eye but is actually a meaningful spread. The conversion to decimal makes the difference obvious: 2.10 versus 1.91 is a 9-10% spread in implied probability, which is dramatic. Most line shopping decisions are between prices that look similar at first glance but differ meaningfully when expressed in a consistent format.
The practical advice is to set your display preference to decimal across all your operator accounts. The mental arithmetic of comparing decimal prices is simpler than comparing fractional prices, and the line shopping decisions are faster and more accurate. The mathematical correctness is identical; the cognitive overhead is materially different.
Closing Line Value as the Key Metric
Closing line value (CLV) is the difference between the price you got and the price at which the market closed on the same selection. Positive CLV means you got a better price than closing; negative CLV means you got worse. The single most important fact about CLV is that average CLV across a sample of bets predicts long-run profitability better than any other available metric.
The reason CLV works as a predictor is that the closing line incorporates all available information about the fixture — including any sharp money that has moved the price between opening and close. A punter who consistently beats the closing line is consistently placing bets before the sharper money has reached the same conclusion. That edge persists.
The CLV metric is calculated bet by bet and averaged across a sample of bets. A typical sharp punter targets positive average CLV of 2-3% across their bet portfolio. A flat or slightly negative CLV indicates the punter is betting at prices roughly equivalent to closing, which means they are essentially competing with the bookmaker margin without a structural edge. A strongly negative CLV indicates the punter is consistently getting worse prices than closing, which is the marker of long-run losing strategies.
For UK MLB punters, tracking CLV requires recording the closing line for every bet you place. The closing price is the price at first pitch (or at whatever time the bookmaker considers “close” for the specific market). Most UK operators do not publish historical closing lines publicly, so tracking requires either personal record-keeping or using third-party odds-aggregation services that maintain historical line data.
The simplest tracking approach is a spreadsheet with columns for date, selection, price taken, closing price, and calculated CLV. Even a basic implementation reveals patterns within a few weeks of consistent betting. A punter who finds their CLV is consistently negative learns something important about either their selection process or their timing — and the diagnosis is more actionable than win rate alone.
Bookmaker Hold Rates and What They Mean
The bookmaker hold rate is the structural margin built into the prices. A market priced at decimal 1.91 on both sides has a hold of approximately 4.7% — meaning the bookmaker expects to retain that fraction of total wagered amounts over time. MLB markets across the major UK operators typically show hold rates of 4-5% on standard moneylines, 5-7% on totals and run lines, and 8-12% on player props and exotic markets.
The US sportsbook industry reported an average hold rate of 10.2% on sports wagering revenue in 2025, up from 9.2% in 2024 — a meaningful increase that reflects structural shifts in the customer base and the markets. UK operator hold rates have been more stable across recent years but show similar patterns of higher holds on exotic markets and lower holds on headline matches.
The line shopping implication is that hold rates vary across operators, and the operator with the lowest hold rate on a specific market is offering the best aggregate value. A bookmaker with a 4% hold on MLB moneylines is consistently offering better prices than a bookmaker with a 5.5% hold, even though the difference on any single bet might be only 1-2%. Across hundreds of bets in a season, the operator-level hold difference translates to a measurable bankroll outcome.
What punters can do about this is concentrate volume at operators with structurally lower hold rates on the markets they bet most often. If you primarily bet moneylines, the operator with the lowest moneyline hold is your primary book. If you bet heavy on player props, the operator with the lowest prop hold is your priority. The choice should be data-driven, based on observed hold rates rather than on marketing material.
Timing the Bet: Open Versus Close
The decision of when to place your bet — at opening, mid-week, or close — has its own expected value implications independent of the selection itself. The general pattern is that opening prices contain more inefficiencies than closing prices because the closing line incorporates more information. Sharp money tends to bet at opening; casual money tends to bet at closing.
The bookmaker pricing engines adjust opening prices over time as new information arrives and as customer betting flows reveal market sentiment. A line that opens at decimal 2.20 on Monday and closes at 1.95 on Wednesday has been pulled in by money on that side — sharp money, casual money, or both. The punter who bet at the opening price captured the move; the punter who bet at the closing price paid the bookmaker’s refined estimate.
For MLB markets, the typical pattern is that lines open 24-48 hours before first pitch and move continuously toward close. The opening prices are usually the inefficient ones for punters who have done their pre-match research; the closing prices are typically sharper. Betting at opening therefore captures more expected value than betting at close, conditional on having a documented edge.
The counter-argument is that opening prices have higher margins than closing prices because the bookmaker is protecting itself against information asymmetries during the early line phase. Some operators price openings with 1-2% additional margin specifically to discourage sharp early action. The net trade-off varies by operator and by market — some operators are more sharp-friendly at opening than others.
Building a Line Shopping Routine
The discipline that converts line shopping from a theoretical exercise to an actual edge is routine. My personal MLB betting evening starts with a slate review — looking at the 5-15 fixtures scheduled that night and identifying which ones interest me. For each interesting fixture, I open the relevant markets at all five of my operator accounts in parallel and note the best price available across the books.
The actual bet placement happens at the operator with the best price on each specific market. The administrative overhead of switching between accounts is real but manageable — using mobile apps and bookmark folders makes the switching faster than it would be otherwise. The routine takes 10-15 minutes for a five-fixture slate, which is acceptable for the value captured.
The diagnostic feedback comes from tracking CLV across the bets placed. If my average CLV across a month of bets is positive 2-3%, the system is working. If it has drifted below zero, something has gone wrong — either my selections have become less sharp, my timing has slipped, or my account mix needs review. The CLV metric gives me an actionable feedback loop that win rate alone does not provide.
Frequently asked questions on MLB line shopping and closing line value
How many UK accounts do I need for effective line shopping?
Three accounts is the minimum to capture meaningful price dispersion; five is the practical sweet spot that balances coverage against administrative overhead. More than seven accounts produces diminishing returns and increases the complexity of managing deposits, withdrawals, and bonus terms across multiple operators. The mix should include two premium books for primary coverage plus mid-tier and specialist operators that occasionally offer the best prices on specific markets.
What is a sensible CLV target for an MLB bettor?
A consistent positive CLV of 2-3% across a sample of 100+ bets indicates a measurable structural edge over the closing line. Below 1% positive is in the noise range — it could be skill or it could be variance. Negative average CLV is a clear warning sign that the selection process or timing needs review. The target is not necessarily to maximise CLV but to keep it consistently positive across a representative sample.
Written by the editors at mlb Online Betting.