MLB Pitcher Strikeout Props: Reading the Line
 Available in US
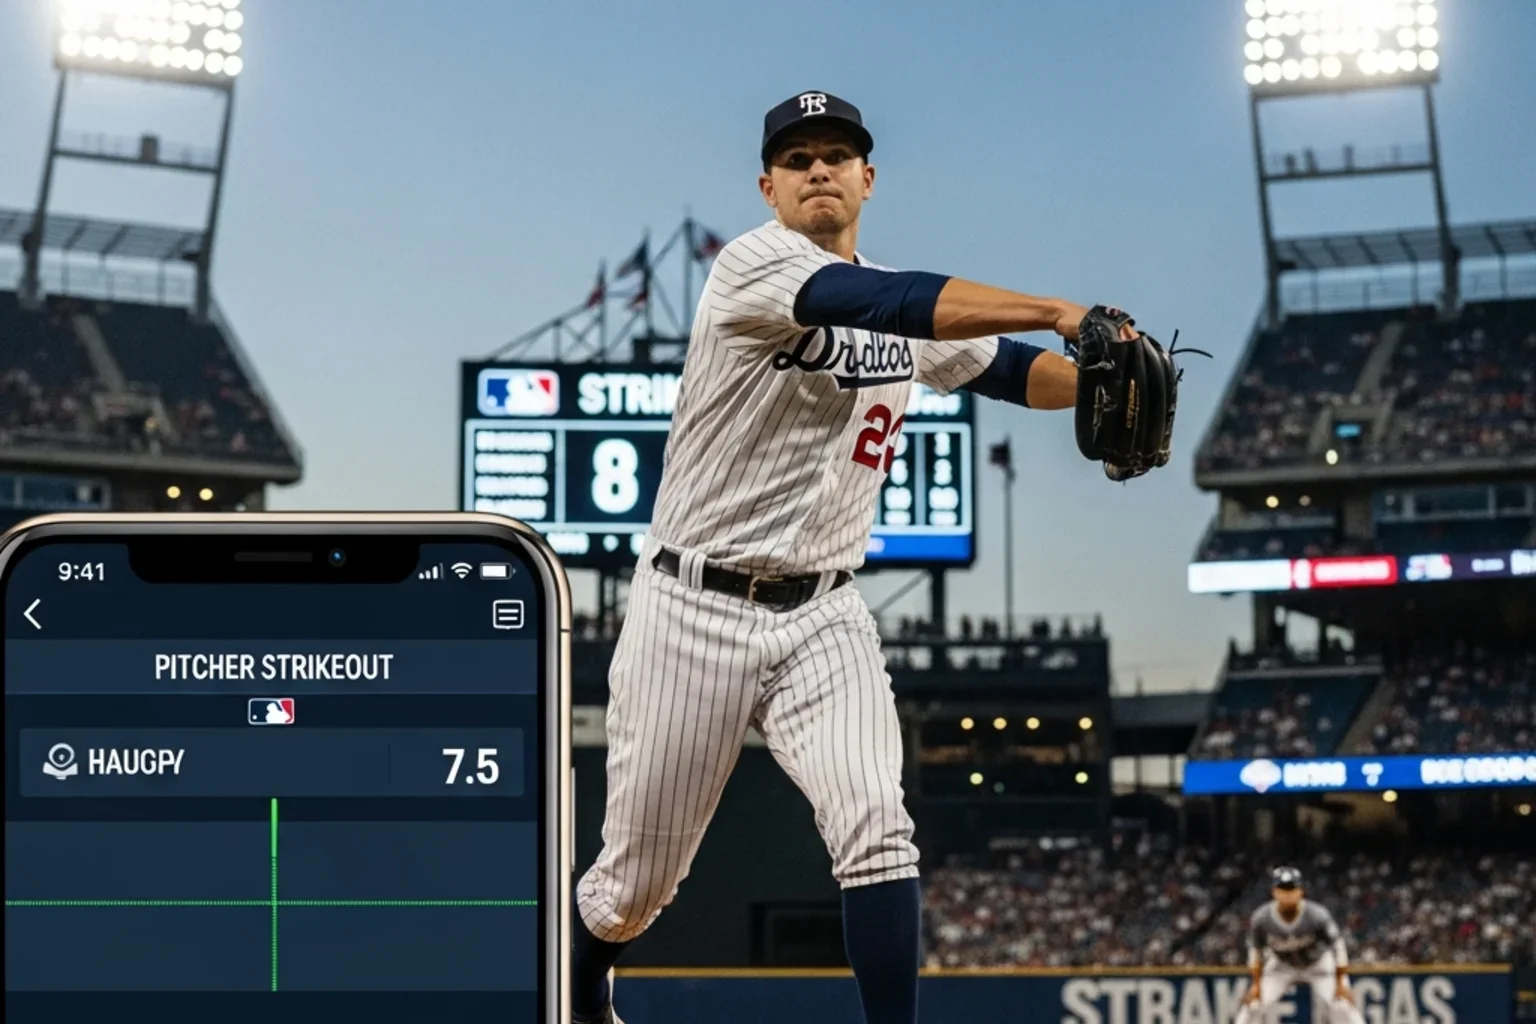
Table of Contents
- The market that lives and dies on pitch count
- How the strikeout line is built
- From K/9 to projected Ks: the calculation in practice
- Opposing lineup quality matters more than people think
- Pitch count caps, the silent line killer
- Live strikeout prop adjustments
- Frequently asked questions on MLB pitcher strikeout props
The market that lives and dies on pitch count
The first time I lost on a strikeout over, the pitcher had eight strikeouts through five innings and got pulled at 78 pitches because his manager was managing him for the playoff push three months away. The line was 6.5. He finished with eight, but I had taken over 8.5 because the matchup looked dominant. That night taught me the lesson every K-prop bettor learns once: it is not just about how good the pitcher is. It is about how long he stays out there.
A pitcher strikeout prop is an over/under bet on the total number of strikeouts a specific starting pitcher will record in a single game. Lines typically sit between 4.5 and 9.5 for established starters, with elite power arms occasionally posted at 10.5 or higher. The strikeout — abbreviated K in baseball shorthand — is the most predictable individual-pitcher outcome in MLB, which is why this market exists and why sharp bettors take it seriously.
The base metric to know is K/9, strikeouts per nine innings. League average K/9 in 2025 sat around 8.5. Elite strikeout pitchers run K/9 north of 12 — that’s where the Spencer Stridder, Tarik Skubal, Garrett Crochet tier of arms live. Below-average strikeout pitchers run K/9 of 6 to 7. K/9 is the headline number, but expected innings pitched is the silent partner. Multiply K/9 by expected innings to get a base projection, and you have the spine of any strikeout-prop decision.
Rob Manfred has framed why this market keeps drawing global money: “We do continue to attract the best players in the world to play in Major League Baseball. We had unbelievable audiences in Korea and Japan last year.” Translated into prop-betting terms, the best arms in the world produce the best strikeout rates, and those rates have become the spine of an entire prop sub-market that did not exist at scale ten years ago. The K-prop has grown alongside the global pitching talent pool, and UK-licensed operators have noticed.
The 2025 season’s average game time of 2 hours 38 minutes, the third straight season inside that 2:40 ceiling, has indirectly shortened starter exposure. Pitch clocks compress at-bat duration, which means hitters see fewer pitches per plate appearance, which means starters reach their organisational pitch-count limits faster relative to the calendar but in fewer innings. This pushes strikeout totals downward across the league.
How the strikeout line is built
The trading desk takes the pitcher’s recent strikeout rate, projects his innings against the opposing lineup, and produces a number. The maths is more transparent than for most props.
Start with a recent K/9 figure — last 4 starts is the typical window, sometimes weighted toward the most recent two. For a starter posting 11.2 K/9 over his last four starts, that’s 1.24 strikeouts per inning. If his expected innings against tonight’s opponent are 6.0, his base projection is 7.45 strikeouts. The trading desk posts a line of 7.5 with juice slightly lower on the under (to reflect the slight push risk if he lands exactly on 7) and slightly tighter on the over.
From there, the desk adjusts for matchup. The opposing team’s strikeout rate against the pitcher’s handedness matters. A team running a 26 percent team strikeout rate is well above league average (around 22.5 percent in 2025); facing such a team, the projection lifts by 5 to 8 percent. The opposite holds: a contact-heavy lineup with a team strikeout rate under 19 percent pushes the projection downward.
Expected innings is the variable most worth scrutinising. Pitch count caps, days of rest, and recent workload all shape how long the starter stays in the game. A pitcher coming off a 110-pitch outing on four days’ rest is rarely allowed past 100 pitches in his next start. If his average pitches per inning is 16, that caps him at 6.25 innings — and if you’re projecting strikeouts off 6.5 innings, you’ve overshot.
The other adjustment is bullpen state. A manager whose bullpen is rested will let the starter throw deeper into the game; a manager whose bullpen is shredded will pull the starter as soon as efficiency drops. This is where game logs and recent series data feed back into prop maths. If the bullpen has been forced to cover six innings the night before, tonight’s starter probably has a longer leash.
From K/9 to projected Ks: the calculation in practice
The simplest version of the strikeout projection is K/9 × (expected IP ÷ 9). Apply to a real-shape example.
A starter with a season K/9 of 10.5, projected for 6 innings tonight: 10.5 × (6 ÷ 9) = 7.0 strikeouts. If the line is 6.5, the over looks favourable. If the line is 7.5, the under looks favourable. If the line is 7, you have a push-risk market where the under is slightly preferable because of how the juice typically prices.
The refinements matter. Use weighted recent K/9, not season K/9 — recency captures changes in repertoire, velocity, or command that the season-long number averages out. Adjust for opposing lineup strikeout rate: a team that strikes out 25 percent of the time against right-handed pitching, facing a right-handed starter, lifts your projection by roughly 10 percent. Combine those two adjustments and you might move from 7.0 to 7.6 — which makes the 6.5 over look stronger and the 7.5 over now look reasonable.
Recommendation engine SportsLine ran their MLB model 10,000 times across the 2025 season and finished 35-29 on moneyline picks. Their strikeout-prop model isn’t publicly tracked the same way, but the underlying approach is similar: simulate the matchup many times, take the average, compare to the posted line. You don’t need 10,000 simulations to make this market profitable. You need a defensible K/9 number, a realistic IP projection, and the discipline to take only the meaningful gaps.
One refinement worth adding: pitchers throwing more breaking balls — sliders, curves, splitters — generally have higher K/9 than pitchers leaning on fastballs. A starter who has shifted his pitch mix in recent starts (more slider usage, fewer fastballs) is often running an elevated K/9 trend that the season averages bury. Pitch-mix data is freely available on baseball stats sites, and reviewing the last four starts before pricing the prop is the kind of homework that separates serious K-prop bettors from casual ones.
Opposing lineup quality matters more than people think
The opposing team’s strikeout rate is a much stronger predictor of strikeout-prop outcomes than most punters realise. A team running a 27 percent strikeout rate against right-handed pitching is, in practical terms, gifting strikeouts to right-handed starters. The Marlins, Mariners, and a couple of other teams have routinely posted team K rates this high across recent seasons.
The opposite is also valuable to know. A team like the Astros, who through the late 2010s and into 2025 have run team strikeout rates closer to 18-20 percent, suppresses pitcher strikeout totals when they’re the opponent. A 7.5 strikeout line against the Astros is harder than the same line against the Marlins, even with the same starter on the mound. Adjusting your projection by ±10 percent based on opponent team K rate is the most reliable single edge in this market.
Splits matter too. Some lineups are strikeout-prone against left-handed pitching but not right-handed, and vice versa. Roster construction has trended toward platoon-friendly lineups, where managers stack right-handed bats against left-handed pitchers. If the opposing starter is left-handed and the opposing manager has flexibility, the lineup that night may not be the same as the season average. Lineup confirmation 90 minutes before first pitch is essential.
Day-game versus night-game splits are smaller but real. Hitters generally strike out slightly more in day games, partly because afternoon shadows make tracking pitches harder and partly because reaction times shift with circadian patterns. The effect is on the order of 2 to 4 percent, but it stacks with other inputs.
Pitch count caps, the silent line killer
A starter who is dominating through five innings on 65 pitches will often get pulled before reaching 90, especially in mid-season starts when teams are managing arm health. Modern MLB pitch-count discipline is real and shapes every strikeout prop.
The typical “soft” pitch-count cap for an in-form starter in mid-season is around 100 pitches. The “hard” cap for a starter coming back from injury or being managed for the playoff push is closer to 85. Knowing which kind of game tonight is — routine outing or managed outing — changes your innings projection by a full inning or more.
Manager tendencies vary widely. Some managers ride their starters past 110 pitches regularly. Others have public reputations for early hooks. The recent five starts for the same pitcher under the same manager give you a tight read on what the leash actually looks like. A pitcher with 5.4 average innings pitched across his last five starts is not going to get to 7 tonight, no matter what the matchup looks like.
For deeper context on how relief decisions cascade into the overall handicap, the MLB bullpen handicap framework covers how bullpen availability dictates manager decisions on starter leash. Every starter pull is also a bullpen entry, and those decisions are linked.
One specific scenario where the leash matters: the playoff-push manager. Mid-September starts for contending teams often see managers pulling their starters earlier than the line implies, because every game matters and the bullpen is the manager’s safest tool. Conversely, late-season starts for teams long out of contention will sometimes see managers letting starters go deep — accumulating innings counts, evaluating young arms — and strikeout totals can run high.
Live strikeout prop adjustments
Live strikeout props are quoted by some UK-licensed operators, with the line refreshed inning-by-inning based on the pitcher’s current pace. Bet365 and a few competitors offer live K-prop markets reliably; smaller books usually do not.
The cleanest live angle is identifying mismatch between current strikeout pace and projected pace. A starter who has 5 strikeouts through 3 innings is on pace for 15 — clearly elite for the night. But the live line might only have moved from 7.5 to 9.5, implying the book has been slow to recognise the dominance. The over at 9.5 may still be value if the matchup suggests sustained domination. Conversely, a starter with 1 strikeout through 3 innings on a line of 6.5 is in trouble; the live under is worth a look if the rest of the lineup looks similarly contact-heavy.
The risk in live K-prop betting is the unexpected pull. A starter who looks dominant can still be removed for an injury concern, a pitch-count rule, or a strategic matchup decision in the seventh. Live unders are vulnerable to early pulls (which lock in low strikeout totals); live overs are vulnerable to mid-game pulls that prevent the pitcher from accumulating more Ks. Sizing live K-prop bets at smaller fractions of bankroll than pre-game bets is sensible.
Frequently asked questions on MLB pitcher strikeout props
How do I project a pitcher’s strikeouts before the line is posted?
Multiply recent K/9 (last four starts, weighted toward most recent) by expected innings divided by nine. Adjust by 5 to 10 percent for opposing team strikeout rate and by another small factor for venue and weather. The product is your base projection; compare to the posted line to identify value.
Do strikeout props void if the pitcher is pulled in the first inning?
Most UK-licensed operators void strikeout props if the starting pitcher does not record at least one out, treating it as no action. If he records any out and is then pulled, the prop typically settles on his recorded strikeouts at the time of removal. Specific terms vary by book.
Why is the pitch clock pushing strikeout totals down?
The pitch clock compresses at-bat duration, reducing pitches per plate appearance. Starters reach organisational pitch-count limits in fewer innings than under the pre-clock regime, which shortens their exposure and reduces total strikeout opportunity per outing.
Published by the mlb Online Betting team.