MLB Home Run Player Props: How They Price and Where the Value Lives
 Available in US
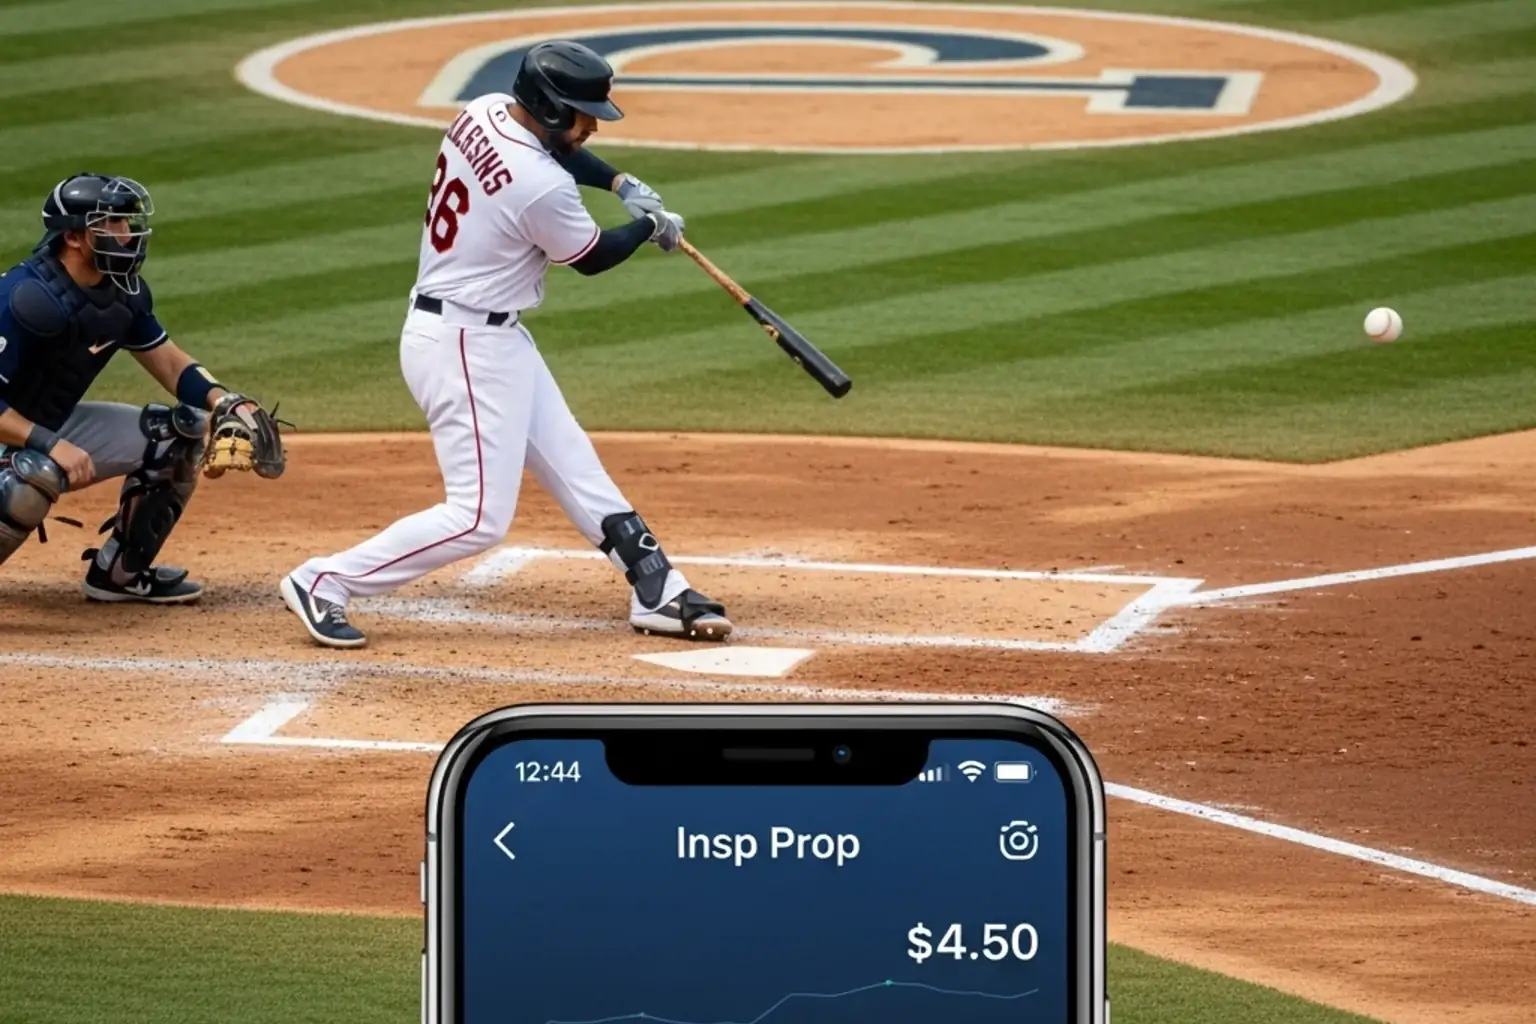
Table of Contents
- The prop that turns a 5-1 game into a personal stake
- The price model from the trading desk side
- Why the park is half the bet
- Weather, wind direction, and the small things that move the line
- The matchup against the starter
- Parlay construction and the correlation trap
- Frequently asked questions on MLB home run props
The prop that turns a 5-1 game into a personal stake
The first home-run prop I ever cashed was a £5 bet on Aaron Judge in his rookie season, when the price was something stupid like 4.50 and nobody outside New York thought he would do what he did. Watching that ball land in the bleachers and realising the rest of the game didn’t matter — that was the day I understood why this market exists. It turns a routine fixture into a personal narrative.
The standard MLB home-run prop is a yes/no market on whether a named player will hit at least one home run in tonight’s game. Pricing typically sits between 4.00 and 10.00 in decimal terms — 3/1 to 9/1 in fractional shorthand — for established power hitters, with prices on contact-first players or weak bats stretching to 15.00 and beyond. It is a fundamentally different beast from team totals, which are bets on the home run output of the entire lineup, or from totals markets, which are runs not home runs.
What makes the home-run prop a serious analytical market — as opposed to a lottery ticket — is the breadth of inputs that shape the price. Ballpark factor, weather, opposing starter’s home-run rate allowed, the hitter’s recent contact quality, batting order position, bullpen exposure if the game runs long. A bookmaker building these prices is essentially running a mini probability engine on every name in the lineup. Edge for the bettor lives in the few inputs the trading desk hasn’t updated since the morning.
One thing to set straight from the top: the standard “to hit a home run” prop is not first home run only. It is any home run during the game, including walk-off shots in the bottom of the ninth. There are separate first-home-run-of-the-game markets at some UK-licensed books, but those are clearly labelled and priced differently.
The price model from the trading desk side
The home-run prop is one of the few markets where I can sketch the trading desk’s logic on a napkin and not be far off. The model starts with a per-plate-appearance home run rate, multiplies by expected plate appearances, and adjusts for context.
Take an established slugger with a 5.5 percent home-run rate per plate appearance — that is a top-15 power hitter pace. Expected plate appearances against an opposing right-handed starter for four to five times at the plate is roughly 4.2 PAs on average across a full game. Multiply: 4.2 × 5.5 percent = 23.1 percent base probability of at least one home run. Convert to fair-value decimal odds: 1 ÷ 0.231 = 4.33. The trading desk adds 15 to 25 percent margin onto this market because home-run props are higher-variance and recreational-heavy, so the posted price might be 5.50 instead.
Now layer the adjustments. Hitter-friendly park: multiply the base rate by the venue’s home-run park factor — Coors at altitude runs about 1.18, Yankee Stadium right field for a left-handed pull hitter is closer to 1.25, Petco runs near 0.85. Weather: a sustained 12-mph wind blowing out at Wrigley boosts home-run probability for pull hitters by 6 to 10 percent. Opposing starter: a pitcher allowing home runs at a 1.5-per-nine-innings rate (well above average) lifts the slugger’s number by 8 to 12 percent.
You can see how the maths compound. A 5.5 percent base rate hitter in a hitter-friendly park, on a warm summer evening with a tailwind, against a homer-prone starter, has a true probability closer to 30 percent — fair odds around 3.33. If the book is showing 5.50, that’s a substantial value gap. If the book is showing 4.50, the gap is smaller but still positive.
This kind of calculation, run a few times across a slate, identifies the two or three prop bets worth a stake any given night. The rest of the lineup is fair-value or worse. The discipline is taking only the prop bets that the maths supports.
Why the park is half the bet
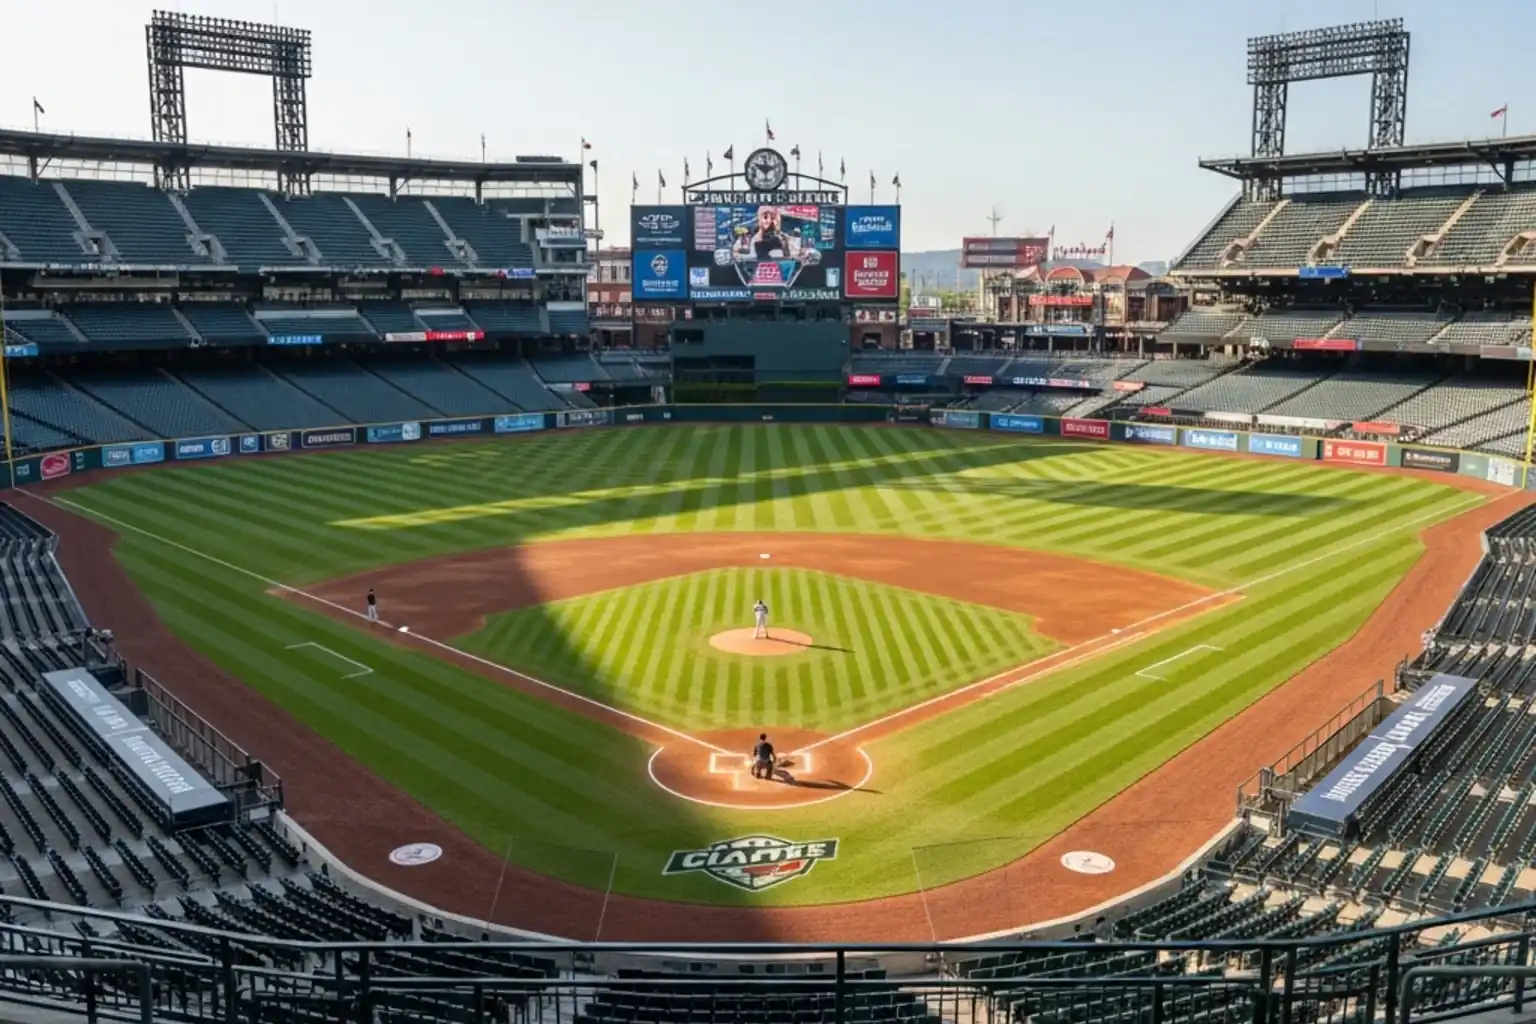
Ballparks matter for every MLB market, but for home-run props they matter more than for any other prop. The difference between Coors Field at altitude and Oracle Park by the bay is approximately a 40 percent swing in home-run probability for the same hitter — that’s the gap between a 6.00 prop and a 4.30 prop in the right matchup.
The mechanism is partly physics, partly architecture. Altitude reduces air density, which reduces drag on the ball, which extends fly-ball distance — typically by 3 to 6 percent at Coors versus sea level. Dimensions matter independently: Yankee Stadium’s short right-field porch (about 314 feet) turns warning-track power into home runs for left-handed pull hitters. Citizens Bank Park’s left-field wall is similarly close. Petco Park’s dimensions are deep all around, and the marine air at night reduces ball carry meaningfully.
The trading desk works with these factors, but it doesn’t always update them in real time. A team playing six games at Coors followed by a road trip to Oracle is dramatically different terrain, and you’ll occasionally see prop prices that haven’t adjusted enough between venues. Aggressive line-shoppers look for these gaps within the first hour after lineups are confirmed.
One specific UK-relevant note: the London Series fixtures have produced unusually high home-run rates because of the temporary outfield configurations at London Stadium and Olympic-era dimensions designed for non-baseball use. The 2024 London Series between the Mets and Phillies drew 108,956 fans across two days and saw a higher-than-average home-run count per game. Anyone betting the London Series 2026 props should price the venue as a hitter’s park by default. For a deeper read on how venue effects compound across an entire model, the MLB ballpark factors breakdown walks through coefficients for every active stadium.
Weather, wind direction, and the small things that move the line
Weather is the input the trading desk gets right most of the time, but it’s also the input that moves fastest between line-posting and first pitch. The bookmaker prices weather based on a forecast issued sometime in the morning. By 19:00 GMT, when UK punters are starting to pay attention, the actual wind direction at the ballpark may have shifted 30 degrees from the morning forecast.
The single biggest weather variable for home-run props is wind direction relative to home plate. Wind blowing straight out from home plate boosts home-run probability by 6 to 12 percent depending on speed. Wind blowing straight in suppresses home runs by similar margins. Cross-winds — winds blowing across the field rather than directly out or in — have smaller effects but matter for specific batter handedness combinations.
Temperature is the secondary weather variable. Hotter air is less dense, which means longer ball flight. A game at 32 degrees Celsius will see roughly 4 to 6 percent more home-run distance than the same game at 12 degrees, all else equal. This is why April baseball under-produces home runs compared to July baseball at the same parks.
Humidity has a smaller but measurable effect — humid air is paradoxically slightly less dense than dry air (water vapour is lighter than the nitrogen-oxygen mix it displaces), so home runs travel marginally further on muggy nights. This is third-order detail, but it stacks with the other factors.
The practical edge: check the live wind direction and temperature about 90 minutes before first pitch, compare to the forecast that was likely used to set the line, and bet props that have not adjusted to current conditions. This is not exotic work — weather services post hourly updates and most UK-licensed operators don’t move prop prices on those updates.
The matchup against the starter
The opposing starter is the other half of the home-run-prop equation. A hitter’s per-plate-appearance home-run rate against the league baseline is one number; their expected rate against a specific pitcher with a specific home-run-allowed history is a different number that can swing 20 to 30 percent either way.
The relevant pitcher metric is home runs allowed per nine innings, often expressed as HR/9. League average HR/9 in 2025 sat around 1.15. A pitcher allowing 1.8 HR/9 is roughly 57 percent more home-run-prone than league average. A pitcher running 0.7 HR/9 is about 39 percent less. Multiply your hitter’s base probability by the pitcher’s HR/9 relative to league average, and you have a first-pass projection of the matchup-specific home-run probability.
Same-handedness versus opposite-handedness matters too. Most hitters have a measurable platoon split — right-handed hitters typically hit slightly better against left-handed pitchers, and vice versa, with the magnitude varying by individual. Pull power versus opposite-field power factors in: a left-handed pull hitter facing a right-handed pitcher with a low-and-away two-strike pattern is harder to home-run-prop than the same hitter against a fastball-up pitcher who pounds the strike zone.
One angle worth flagging. Pitchers who throw 60 to 70 percent fastballs allow more home runs per contact than pitchers who lean on breaking pitches. A hitter facing a 95-mph fastball at the top of the zone produces fly balls; a hitter facing 87-mph sliders down and away produces ground balls. The fly-ball rate is the gateway statistic to home-run probability, and pitchers who suppress fly balls suppress home runs almost automatically.
Parlay construction and the correlation trap
Home-run props are popular parlay legs because the prices are long enough that two or three of them stacked together produce eye-catching returns. Three HR props at 5.00 each parlayed return 125 times the stake if all three land. The visual appeal is obvious.
The trap is correlation. Two hitters in the same lineup hitting home runs is positively correlated — the conditions that favour one (hitter-friendly park, weak opposing starter, tailwind) favour the other. Bookmakers know this and price same-game parlays to reflect the correlation, often shorter than the straight multiplication of individual prop prices would suggest. A naive multiplication of 5.00 × 5.00 gives you 25.00; a same-game parlay version might be priced at 18.00 or 19.00, recognising the correlated probability.
The cleaner parlay structure is single-leg props from different games, sometimes called a “round-robin” or “across-the-card” parlay. Two hitters from different teams in different cities have nearly independent probabilities, so the multiplication is closer to fair. The price you get from a UK bet builder will still include vig, but the correlation discount is smaller.
One discipline that has held up over years: cap home-run-prop exposure at 2 to 3 percent of bankroll per slate, no matter how attractive the prices look. The variance on these markets is enormous, and a five-night losing run on what looked like value bets is normal — not a sign the system is broken.
Frequently asked questions on MLB home run props
Is the to hit a home run prop limited to the first home run?
No. The standard yes/no home run prop pays out on any home run hit by the named player during the game, regardless of when it occurs. First-home-run-of-the-game markets exist separately and are clearly labelled at most UK-licensed operators.
How much does a tail-wind change HR-prop value?
A sustained 12-mph wind blowing out from home plate typically lifts home-run probability by 6 to 10 percent for pull-side hitters at the right venue. If the line was set on a still-air forecast and the wind picks up by first pitch, the prop is mispriced in the punter’s favour until the book updates.
Prepared by the mlb Online Betting editorial staff.