MLB All-Star Game and Home Run Derby Betting Guide
 Available in US
Table of Contents
- Two Very Different Products in One MLB Weekend
- What the All-Star Game Format Does to Pricing
- American League Versus National League: What the Historical Pattern Actually Shows
- The Home Run Derby Format and Why It Is the Better Bet
- Derby Bracket Markets and Where the Real Action Is
- Props and the All-Star Game MVP
- Frequently asked questions on MLB All-Star and Derby betting
Two Very Different Products in One MLB Weekend
The MLB Midsummer Classic weekend is the only weekend on the baseball calendar where the headline broadcast is an exhibition game and a home run hitting competition that has no relationship to the standings whatsoever. From a UK betting perspective, that is a genuinely strange product mix. The All-Star Game and the Home Run Derby are scheduled within 24 hours of each other, broadcast through the same television package, and marketed together — but they should be bet as if they have nothing in common, because mechanically they do not.
The 2025 MLB All-Star Game and Derby drew 17.8 billion social media views across MLB-affiliated accounts during the season, up roughly 20% on the previous year, which gives you a sense of the cultural pull this weekend has — even by US standards, even before you factor in international growth. For UK punters who normally engage with MLB through individual fixture pricing, the All-Star weekend is the most marketing-heavy weekend of the season, and the betting markets reflect that with deeper, exotic-heavier menus than the typical fixture provides.
I will admit upfront that I bet conservatively on this weekend. The expected value is genuinely poor on most of the All-Star markets because the events are exhibitions, the bookmaker margins are wide, and the player decision-making does not follow regular-season patterns. The Home Run Derby is the more interesting of the two products and I will spend more time on it, but the All-Star Game itself is essentially an unbettable spectacle that some operators dress up in market depth specifically to attract casual money.
What the All-Star Game Format Does to Pricing
A friend who came to baseball through cricket once asked me why the All-Star Game was scheduled if neither side was trying to win it. The honest answer is that it has, at various points, mattered for postseason home-field advantage and at other points been a pure exhibition. Bookmaker pricing has had to adapt across both regimes, and the current format means the game itself is functionally an exhibition with rotating rosters and capped pitcher appearances.
The format has direct pricing consequences. No starter throws more than two innings. The lineup rotates through nine to twelve hitters per side. Position players sometimes pitch in the late innings. The game can be decided on a one-run rally by reserves no one watching has heard of. None of those characteristics survive bookmaker modelling cleanly — the pricing engines try to estimate run distributions for a game where the underlying mechanism is unlike anything else on the calendar.
What that means in practice is that the All-Star Game moneyline is a coin flip dressed up as a baseball bet. The American League versus National League pricing typically opens close to 1.90/1.90 with a few cents either way, and that pricing reflects the bookmaker’s honest assessment that they have no useful edge. The juice on the moneyline is thin enough that it is not exactly bad value, but it is not exactly bettable either — you are paying for entertainment, not for expected return.
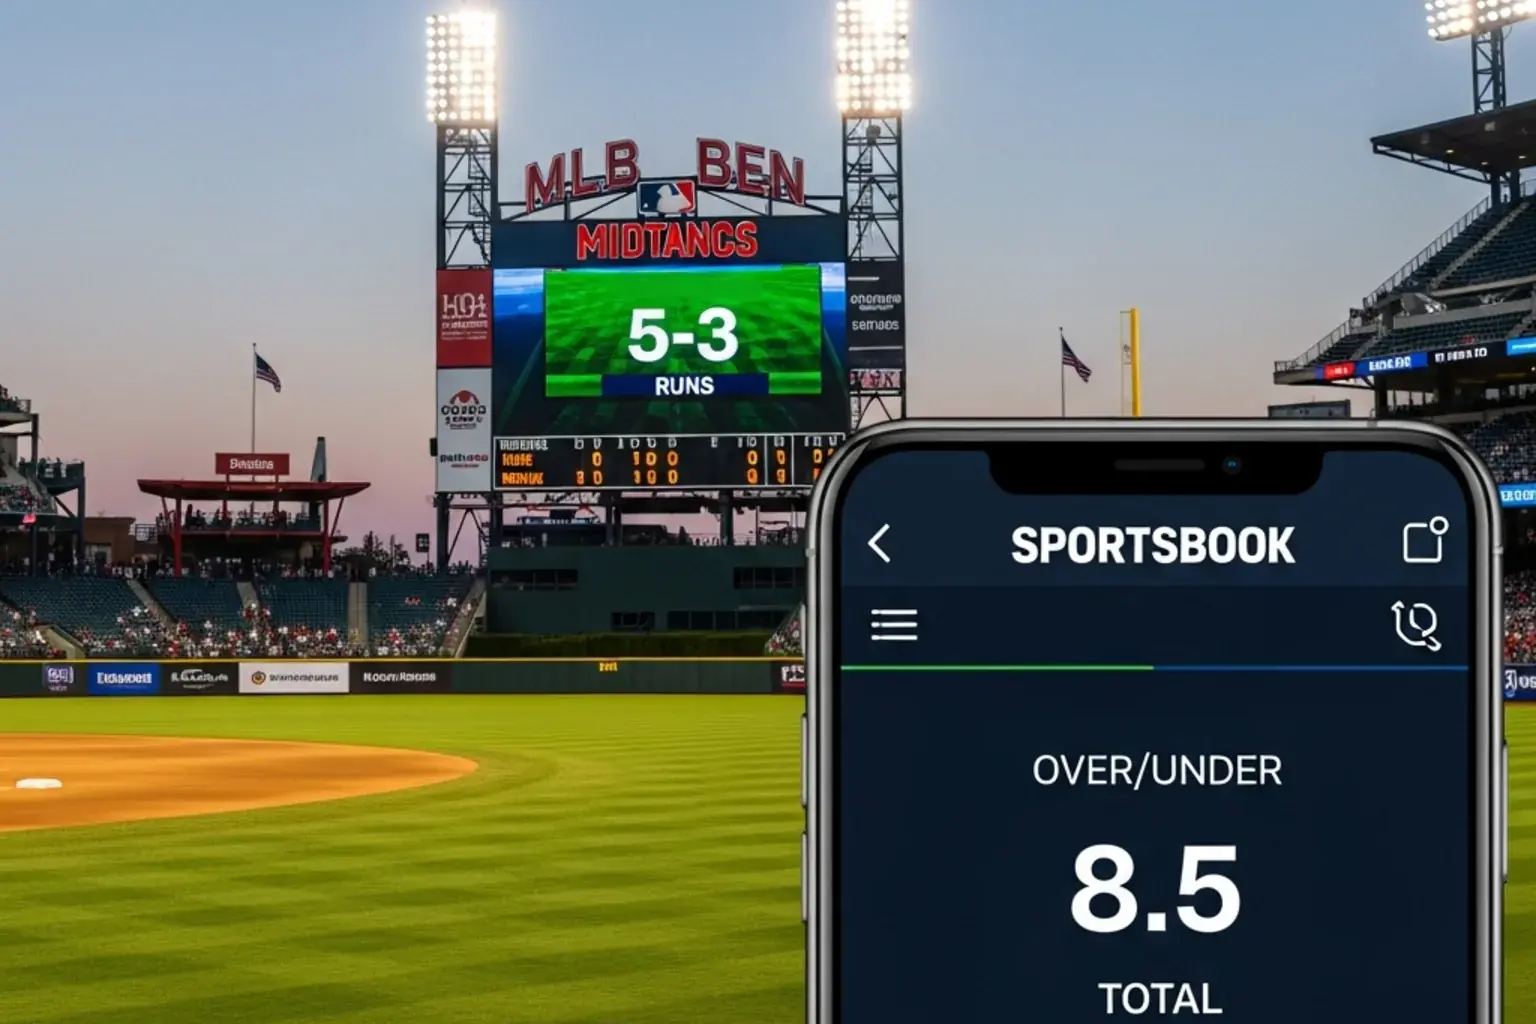
The total is more interesting. The All-Star Game total typically sits around 8.5 to 9.5 runs, which sounds reasonable, but the variance around that number is enormous because the game’s offensive structure swings on individual home runs from premium hitters facing pitchers they have never seen and would never normally face in a regular-season context. Recent All-Star Games have ranged from 5 to 14 combined runs. The standard deviation is genuinely higher than a regular-season game with comparable starting pitching projections.
Bookmaker margins on All-Star Game markets are noticeably wider than on regular fixtures. The moneyline might carry a 4-5% margin (similar to regular games), but the totals and exotic markets often carry 8-12% margins because the bookmaker is genuinely uncertain about the distribution and protects itself accordingly. UK punters who line-shop find smaller price differences across books on All-Star markets than they do on regular fixtures, which is itself a clue that the books are pricing wide and not trying to be sharp.
American League Versus National League: What the Historical Pattern Actually Shows
The historical AL-versus-NL split in the All-Star Game has shifted enough times across the modern era that any pattern you might point at gets contradicted by a longer time series. The American League dominated the period from 1997 to 2009, winning 12 of 13 games. The National League pulled back into competitive parity in the 2010s. Recent results have been roughly even.
The reason the historical split matters less than people think is that the game’s format has changed several times in those decades, the rosters have been constructed under different selection rules, and the strategic importance attached to winning has fluctuated. A bookmaker modelling the current matchup is not going to weight the 2003 result in any meaningful way. The opening line is built from the current rosters and pitching usage projections only.
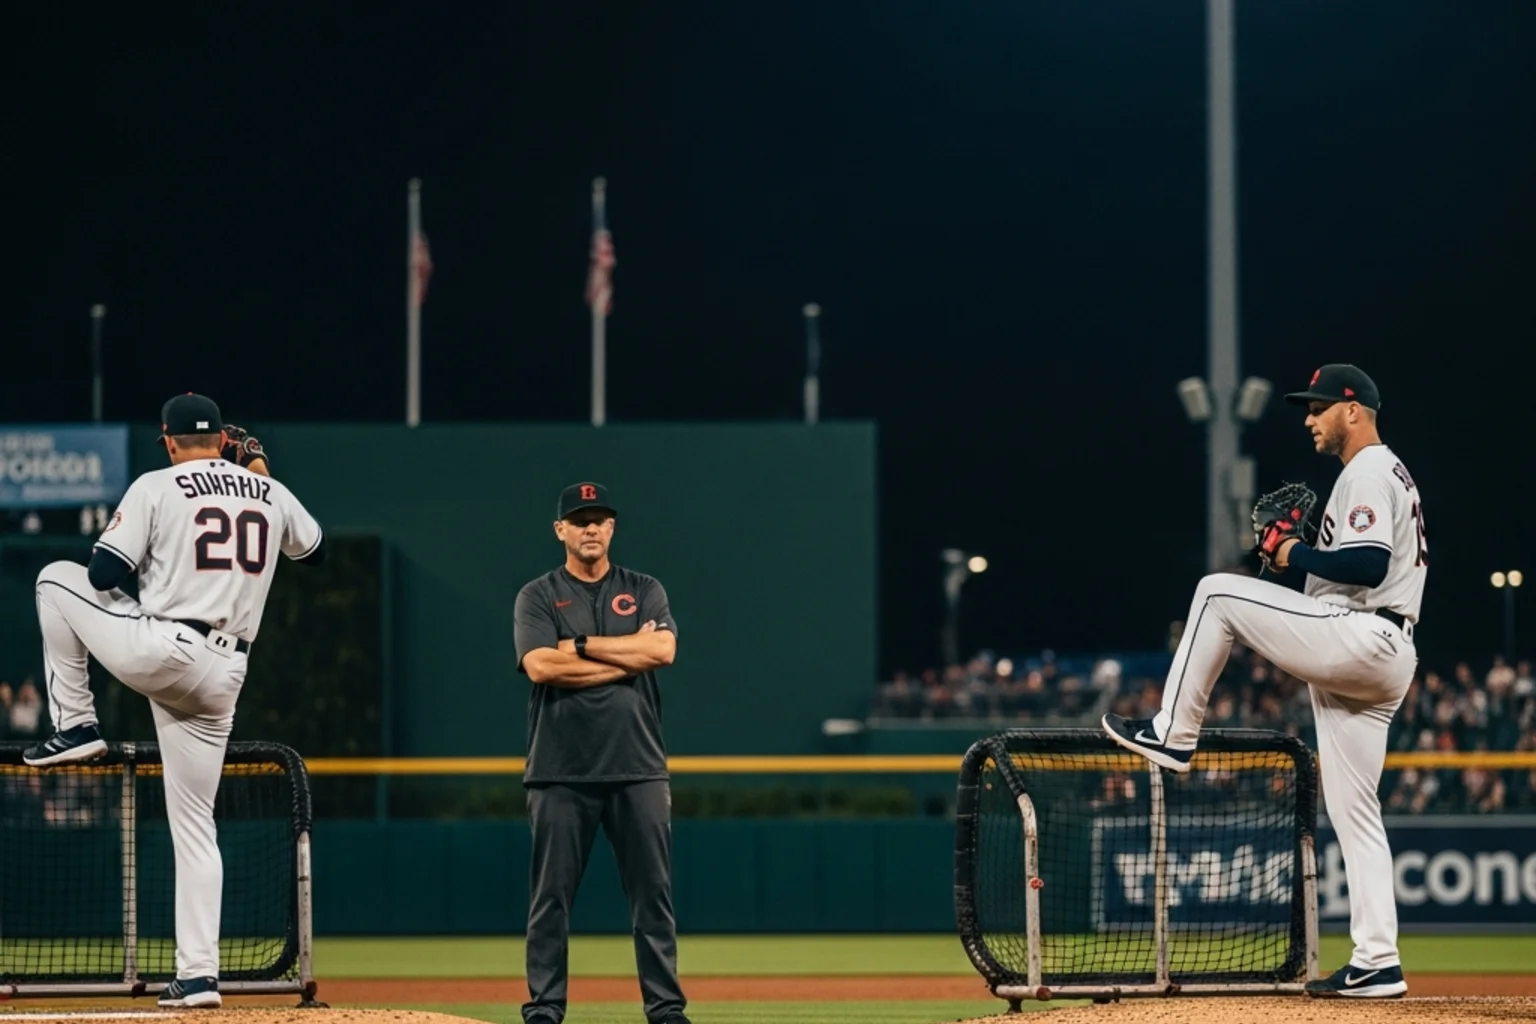
What does matter is the starting pitcher matchup announced shortly before the game. The two leagues choose their starting pitchers separately, and the choice often signals whether the manager is treating the game as a genuine competitive exercise or as a showcase. A starter who has not pitched in five days, throwing one inning of pre-arranged pitching, is a different animal than a starter who is being deployed as a hard-throwing two-inning weapon. UK punters who track this signal pre-match can sometimes catch a moneyline that has moved gently in one direction based on the starter announcement.
The lineup announcements matter less. Almost every All-Star is going to play, the order is mostly cosmetic, and the depth of the bench means individual starters generally play four or five innings of the rotation before being replaced. The bookmaker pricing already assumes maximum lineup depth on both sides.
The Home Run Derby Format and Why It Is the Better Bet
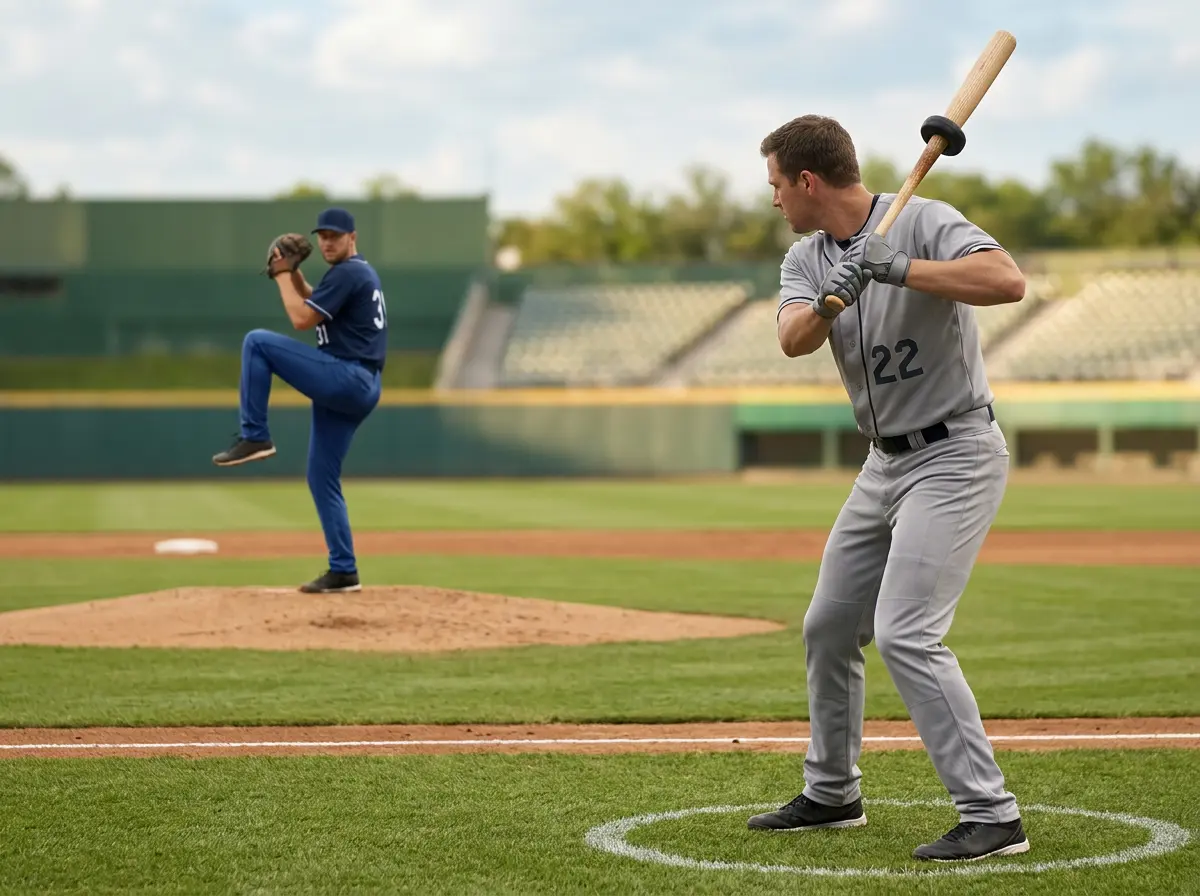
The Home Run Derby is structurally a much cleaner betting product than the All-Star Game. It is a head-to-head bracket competition between eight power hitters, played in three rounds (quarter-final, semi-final, final), with each round timed and counted by home runs hit within the allotted minutes. The outcome is a single trophy and a bracket worth of individual matchups.
The reason the Derby is more bettable than the game is the cleanliness of the input data. Power hitters have well-measured home run rates, exit velocity averages, launch angle distributions, and pull/spray tendencies. The Derby format favours specific batting profiles — high exit velocity with consistent loft, ideally with the ability to pull batting practice fastballs over the wall. UK punters who do their homework can identify which entrants fit the format and which are participating for the publicity but lack the optimum profile.
The Derby outright market opens roughly two weeks before the event, once the eight participants are confirmed, and typically prices the favourite around decimal 4.0 to 5.0 — a moderate compression that reflects bookmaker uncertainty across the bracket. The longer-shot entrants run out to 9.0 to 13.0. There is genuine value to be found if you can identify a long-shot whose batting profile is unusually well-suited to the Derby format and unusually poorly known to casual punters.
My approach to the Derby outright is to focus on three statistical inputs. The first is current-season exit velocity, which is publicly available through MLB Statcast data and is the single best predictor of Derby performance. The second is barrel rate, which captures the combination of speed and angle that produces home runs reliably. The third is pull rate, because Derby venues reward pull-side power more than opposite-field power. A hitter who scores well on all three inputs at a long Derby price is usually a value bet, even when the bookmaker is reasonably calibrated.
The bookmaker can be reasonably calibrated and still leave value on the table because the Derby is dominated by recency effects. A hitter who has had a hot June heading into the All-Star break gets backed by the public, his price compresses, and a hitter with comparable underlying numbers but a quieter recent month drifts to better value. Recency bias is the most reliable inefficiency in Derby pricing.
Derby Bracket Markets and Where the Real Action Is
Beyond the outright winner, UK bookmakers offer a range of Derby-specific bracket markets that are genuinely interesting for any punter who has done the underlying profile research. Round-by-round eliminations, head-to-head matchups within rounds, total home runs across the entire Derby, and home run handicaps between specific hitters all feature on the menus of the more developed operators.
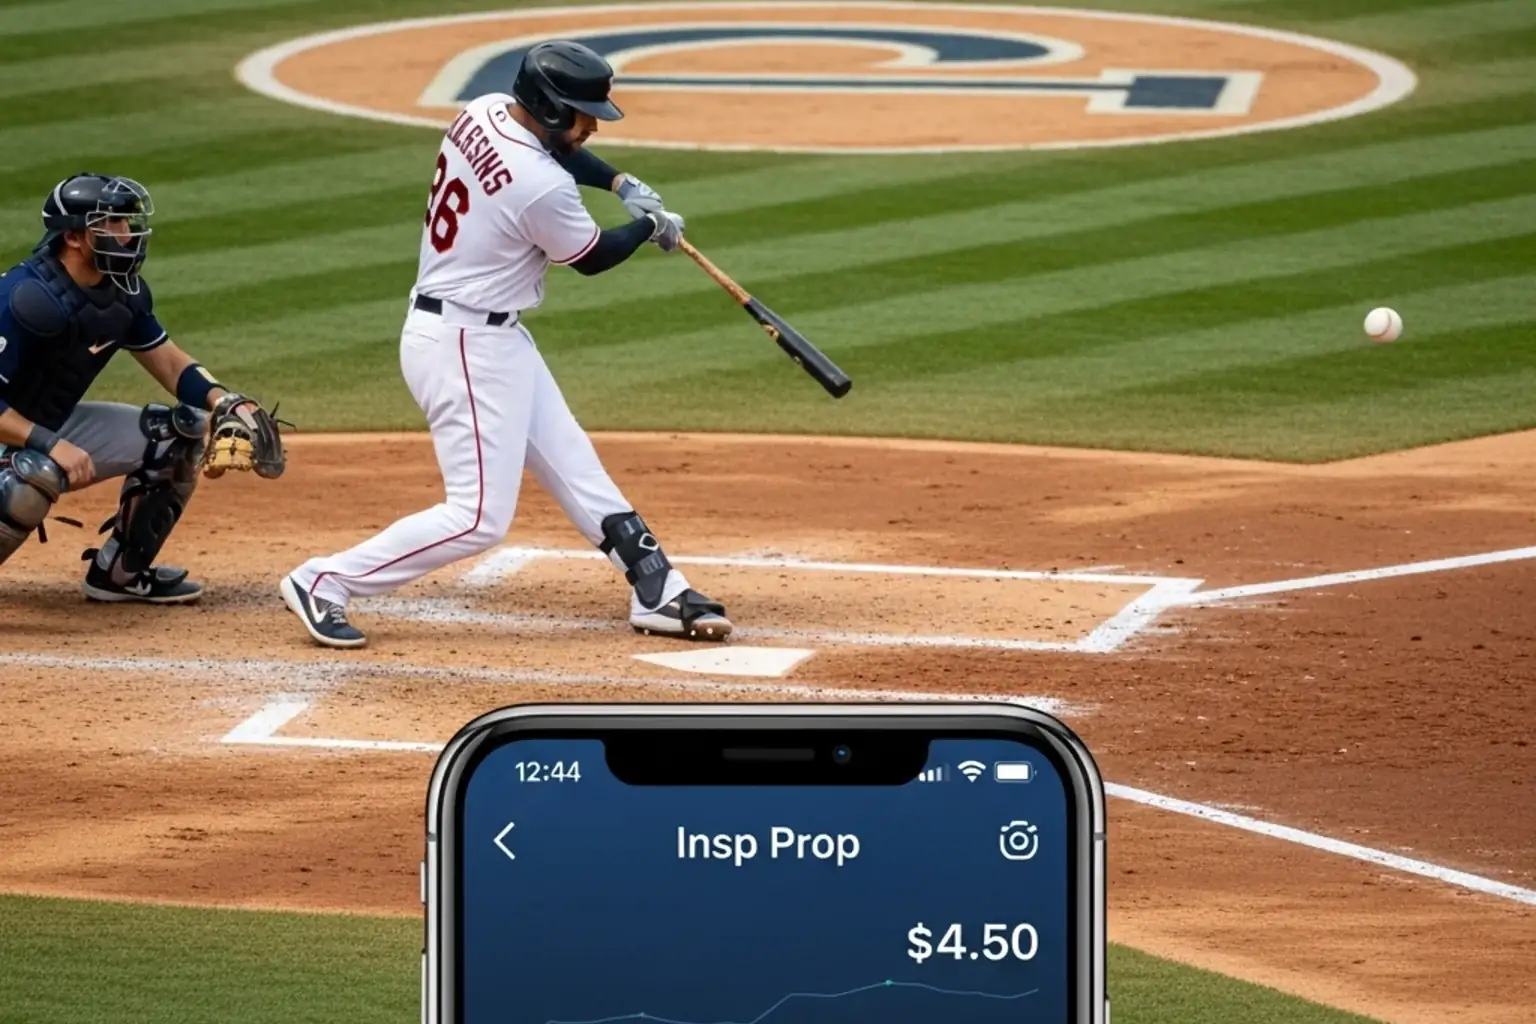
The head-to-head matchups in the opening round are where I find the most reliable value. Two hitters facing off in a one-round timed competition is a sharper bet than the eight-way outright, because the variance is lower and the specific matchup characteristics matter more. If you have done the work on exit velocity and barrel rate for both participants, you have a real advantage over a bookmaker pricing engine that is mostly using last-year and current-season home run totals as inputs. The home run prop framework for regular-season pricing applies almost directly to Derby head-to-head matchups, with the additional twist that the pitcher is a coach throwing batting-practice fastballs rather than a real opponent.
The total home runs across the Derby is a market I bet sparingly because the variance is enormous — a single hitter going on a long run in the semi-final can swing the total by 15-20 home runs. The pricing tries to reflect that variance, but UK books generally set the total slightly low because the public over-estimates how often the Derby produces hot streaks. A small over position with the right total line is sometimes available.
Handicap markets within head-to-head Derby matchups are usually priced cleanly but with wide margins. A favoured hitter giving four home runs to a less favoured hitter at decimal 1.90 implies a roughly 53% chance after juice, when the true probability might be 58%. The handicap is essentially a margin-of-victory bet within a single round, and it rewards punters who can estimate not just who will win the round but by how many.
Props and the All-Star Game MVP
The All-Star Game MVP is a peculiar market because the winner is the player who looks most decisive in the broadcast highlights, which often correlates with hitting a home run in the late innings but is fundamentally a judgement call by media voters. The pricing reflects the difficulty of predicting that judgement: opening favourites typically sit around 11.0 to 15.0, and the field beyond the top six or eight is priced into double-digit decimals.
I bet the MVP only when there is a specific catalyst — a hometown hitter playing in their own park has a slight psychological premium with voters; a recent batting-title leader carries narrative weight; a player coming off a multi-home-run game heading into the break gets sentimental attention. None of these are huge edges, but the long prices on the MVP market mean even small edges produce reasonable expected value.
Frequently asked questions on MLB All-Star and Derby betting
Is the Home Run Derby a separate market from the All-Star Game?
Yes. The Derby has its own outright market, bracket markets, and head-to-head matchups, all of which settle the night of the Derby itself. The All-Star Game has separate moneyline, total, and MVP markets that settle the following night. There is no combined Derby-and-Game product at most UK bookmakers, though some operators offer themed promotional accumulators that span the weekend.
Why do bookmakers cap stakes on All-Star Game markets?
The pricing engines have less confidence in their projections for an exhibition game than for a regular-season fixture, so operators reduce maximum stakes to limit their exposure to large bets they might be mispricing. This is standard practice across UK-licensed books for any market where the underlying model is genuinely uncertain — the cap is the operator’s protection against asymmetric risk.
Written by the editors at mlb Online Betting.